SEQUENTIAL OPERATORS
Guided measurement examination
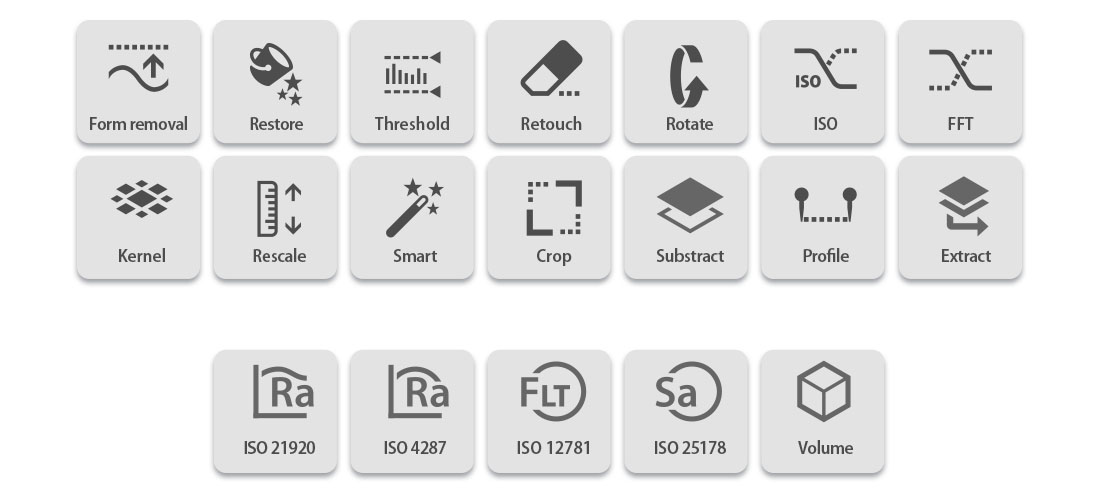
A smart suite of operators, which can be applied to 3D/2D measurements and profiles, provides the opportunity to remove form, apply a threshold, retouch data points, restore non-measurable data and apply a range of filters and/or generate alternative layers by cropping, subtracting or extracting a profile, to prepare your data analysis.

Form removal
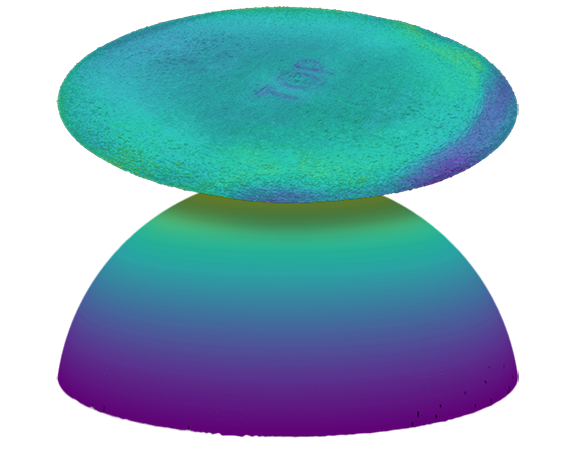
The form removal SensoVIEW’s operator is used for samples that need to be leveled due to a tilt (linear form), an inherent spherical or cylindrical component, or that exhibit or possess an unwanted polynomial term. Several options are available: plane, main slope, cylinder, sphere or polynomial degree. The outcome can be selected between removed or subtracted result.

Form removal
The form removal SensoVIEW’s operator is used for samples that need to be leveled due to a tilt (linear form), an inherent spherical or cylindrical component, or that exhibit or possess an unwanted polynomial term. Several options are available: plane, main slope, cylinder, sphere or polynomial degree. The outcome can be selected between the removed or subtracted result.

Threshold
Useful for filtering the data by adjusting sliders on a histogram. Z values outside the slider’s limits are set to non-measured points.
Crop
New areas can be extracted from a raw measurement or from an ‘operated’ measurement to select the region of interest from your sample (several shapes available: square, square fitted to the object, circle or freeform).
Threshold
Useful for filtering the data by adjusting sliders on a histogram.
Z values outside the slider’s limits are set to non-measured
points.
Crop
New areas can be extracted from a raw measurement or from an ‘operated’ measurement to select the region of interest from your sample (several shapes available: square, square fitted to the object, circle or freeform).
Restore
The Restore SensoVIEW’s operator is used to fill (replace) non-measured data points with Z values. This is done either by using adjacent ‘good’ data to interpolate a replacement value, or by simply replacing all non-measured points with a fixed value. The user can choose between restoring the complete area or filling only zones either selecting areas to avoid the restore or filling only zones with less than a certain number of points.
Rescale
This applies a user-defined vertical factor and vertical offset to the data. It is an ideal operator to create an inverted 3D of your sample, for measuring replicas.
VIDEO TUTORIAL
How to interact with operators and profile tools?
PROCESS DATA WORKFLOW
Doing repetitive tasks, efficiently
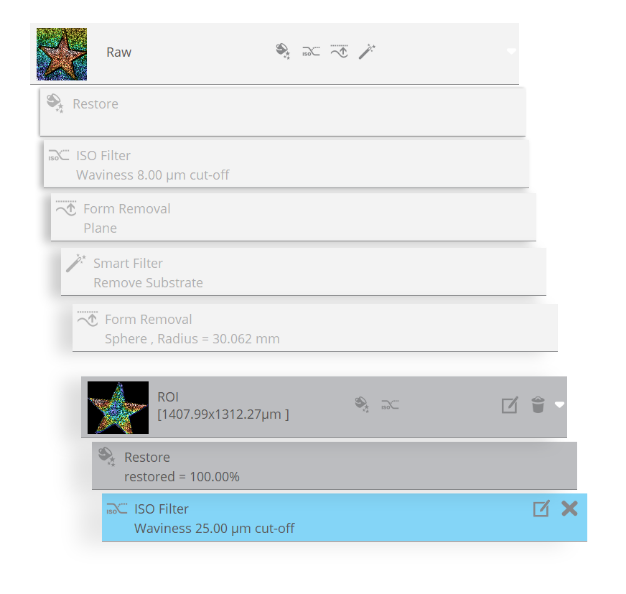
SensoVIEW offers the possibility of adding up filters and calculations in a sequential workflow. At any time, the user can click to any specific step of the workflow and see the result or the settings used on the operator/analysis.
SensoVIEW offers the possibility of adding up filters and calculations in a sequential workflow. At any time, the user can click to any specific step of the workflow and see the result or the settings used on the operator/analysis.


PROCESS DATA WORKFLOW
Automate your data analysis with templates
When the analysis process is defined, the user can create a template to apply it to multiple measurements. The template will contain all the information from the filters, operators, and critical dimensions used, as well as the export settings. Besides that, any possible shift or rotation between the template and the topography can be corrected using SensoVIEW’s pattern recognition algorithms.


